Tech Tools
Technology is just one of the many tools that students can use to engage with mathematics and other STEM topics. Many of our challenges incorporate exciting opportunities to engage with technology that may be new to you as learners and entrepreneurs. This page outlines some of the most common tools used throughout the Design & Pitch Challenges and provides links to tutorials so you can learn how to harness the power of these tools.
TinkerCAD
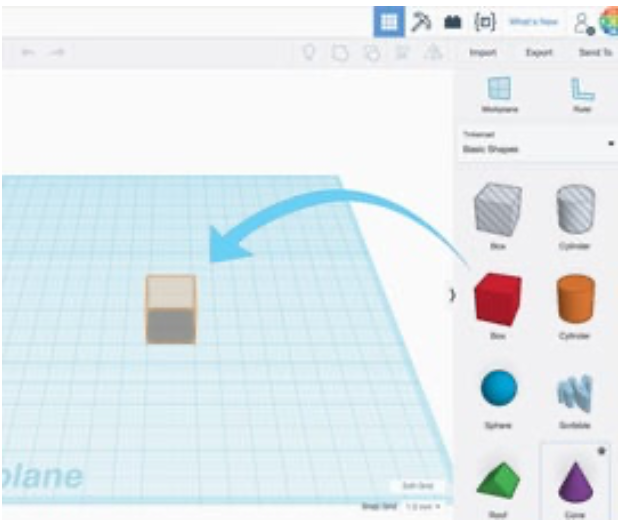
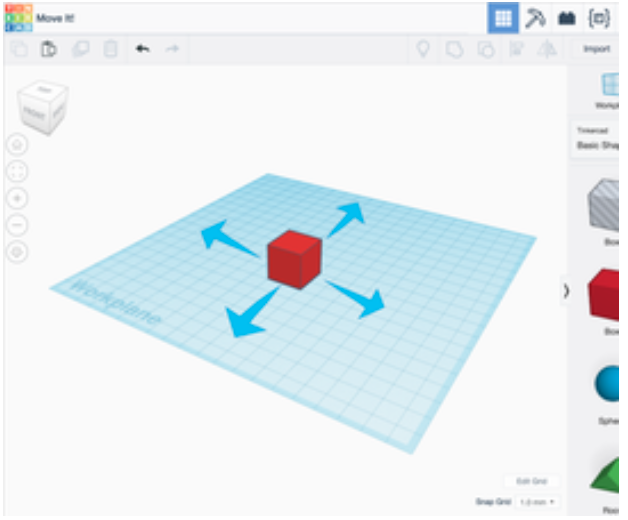
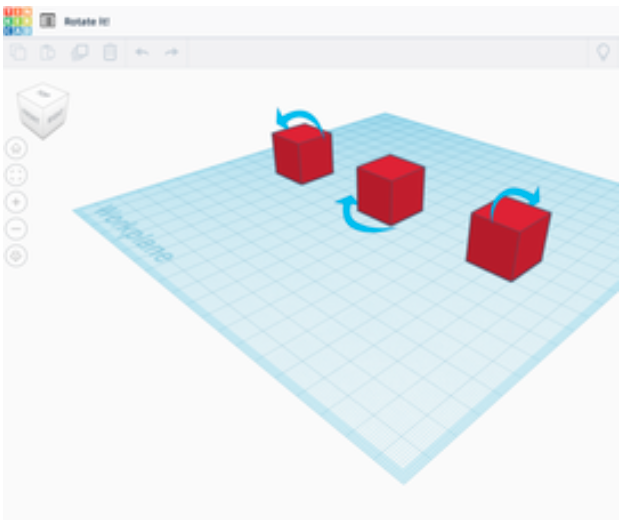
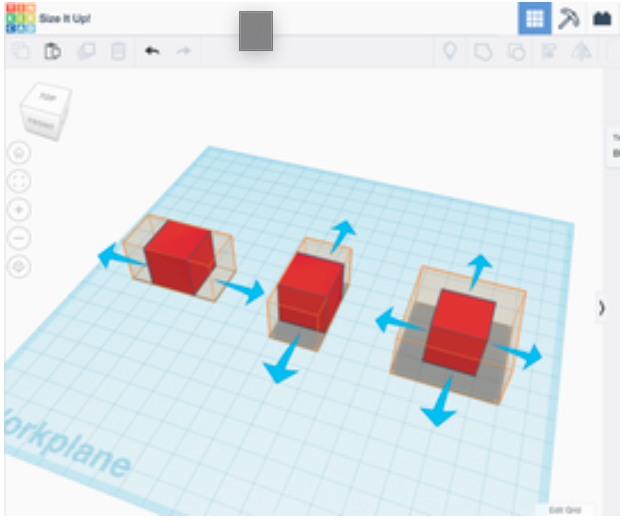
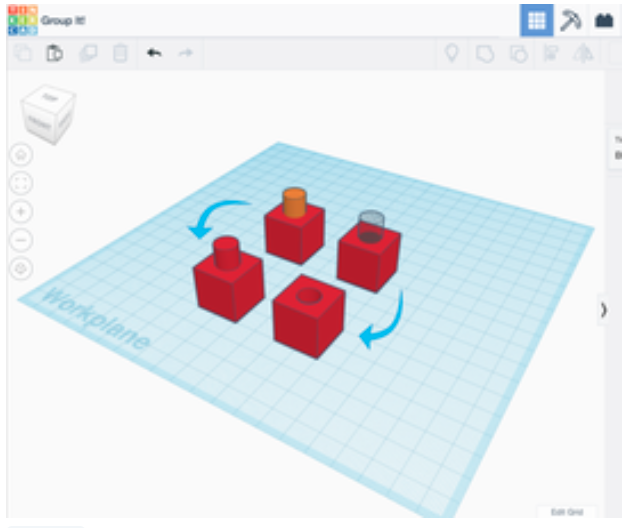
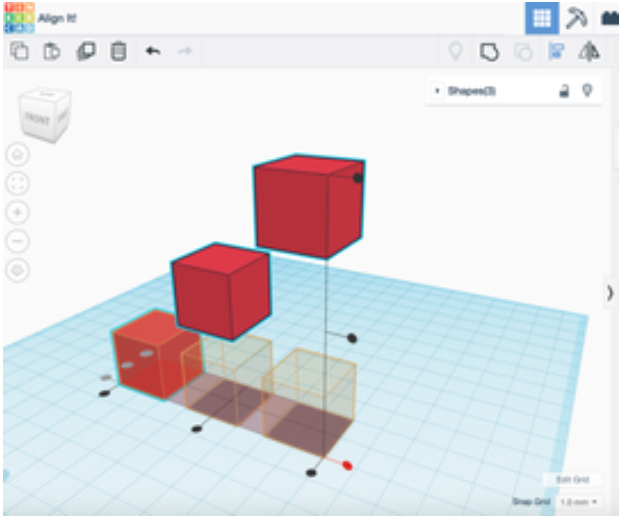
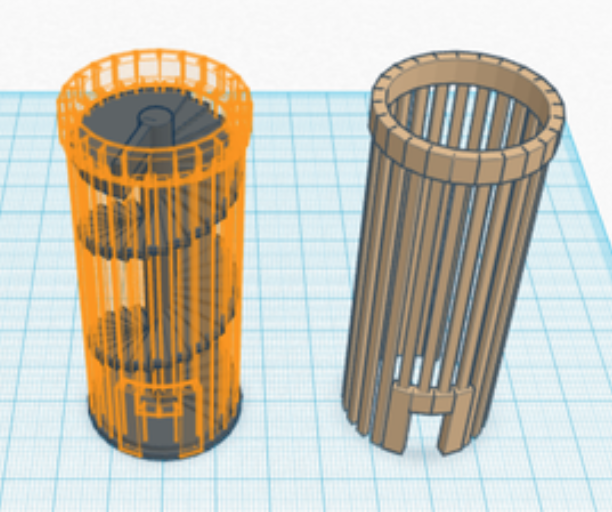
Use the following tutorials to familiarize yourself with the layout and capabilities of TinkerCAD. Before you get started, read this How To Guide to learn how to set up an account and get started.
Spreadsheets
Building a Financial Business Plan
Your financial business plan is an estimate of how your business will balance its revenue with its costs in order to eventually make a profit or break even. If a business does not make a profit or break even immediately, then you may have to take out a loan or find someone to invest in your business for partial ownership.
Use the Prototype to Profit Financial Business Plan Resource to build your financial business plan. You will need to consider one-time expenses, ongoing expenses, revenue, and profits. One-time expenses occur only one time. Ongoing expenses are ones that are needed to build additional versions of the product, to market and sell the product, and to run a business. Usually financial business plans project these by the month.
Developing a Sliding Price Scale
Use this resource to build your Sliding Price Scale for the Erase Food Waste challenge and show how it would work with a real example.
Ratings, Rankings, and Weighted Categories
Use this resource to learn about ranking and rating algorithms, weighted categories, and spreadsheets: Building Algorithms – Spreadsheet Resource
Desmos
Finding the Break Even Point
Use this resource on Desmos to learn how to find the break even point for your business in the Prototype to Profit challenge. The break even point is the point when your business expenses equal your revenue. Before you can use this tutorial, your teacher will need to assign it to you.
GeoGebra
Exploring Transformations
Technology can help you visualize and demonstrate the transformations you use in your Flashy Fashion solution. One free tech tool that you can use is called GeoGebra. If you have never done transformations on GeoGebra before, you can use this guide to learn how to do it.
Datawrapper
Building a Data Visualization
Technology can help you build a data visualization that you use in your Keep it Real solution. One free tech tool that you can use is called Datawrapper. If you have never used Datawrapper before, you can use this guide to learn how to do it.
